Skip to content

Ask a question. Get a live view of the work already in Duvo.

Operating Insights builds interactive dashboards in chat from current Duvo data. Every number stays linked to the decisions, approvals, and outcomes behind it.

Traditional reporting makes every question a project.

Spreadsheets, BI tickets, and analyst hand-offs delay the answer while the underlying data keeps changing.

Data prep before every chart

Before you can chart anything, you have to export the data, clean it, and connect it. One team built a separate automation just to extract performance data.

Days of work per view

A clear view took Excel, Google Sheets, pivot tables, and several people working in sequence. Every new question started the process again.

Stale numbers, single owner

Snapshots start ageing as soon as they are built. If the spreadsheet owner is away, the numbers stop moving; every change waits on a BI ticket or analyst hand-off.

Describe the view, then refine it in chat.

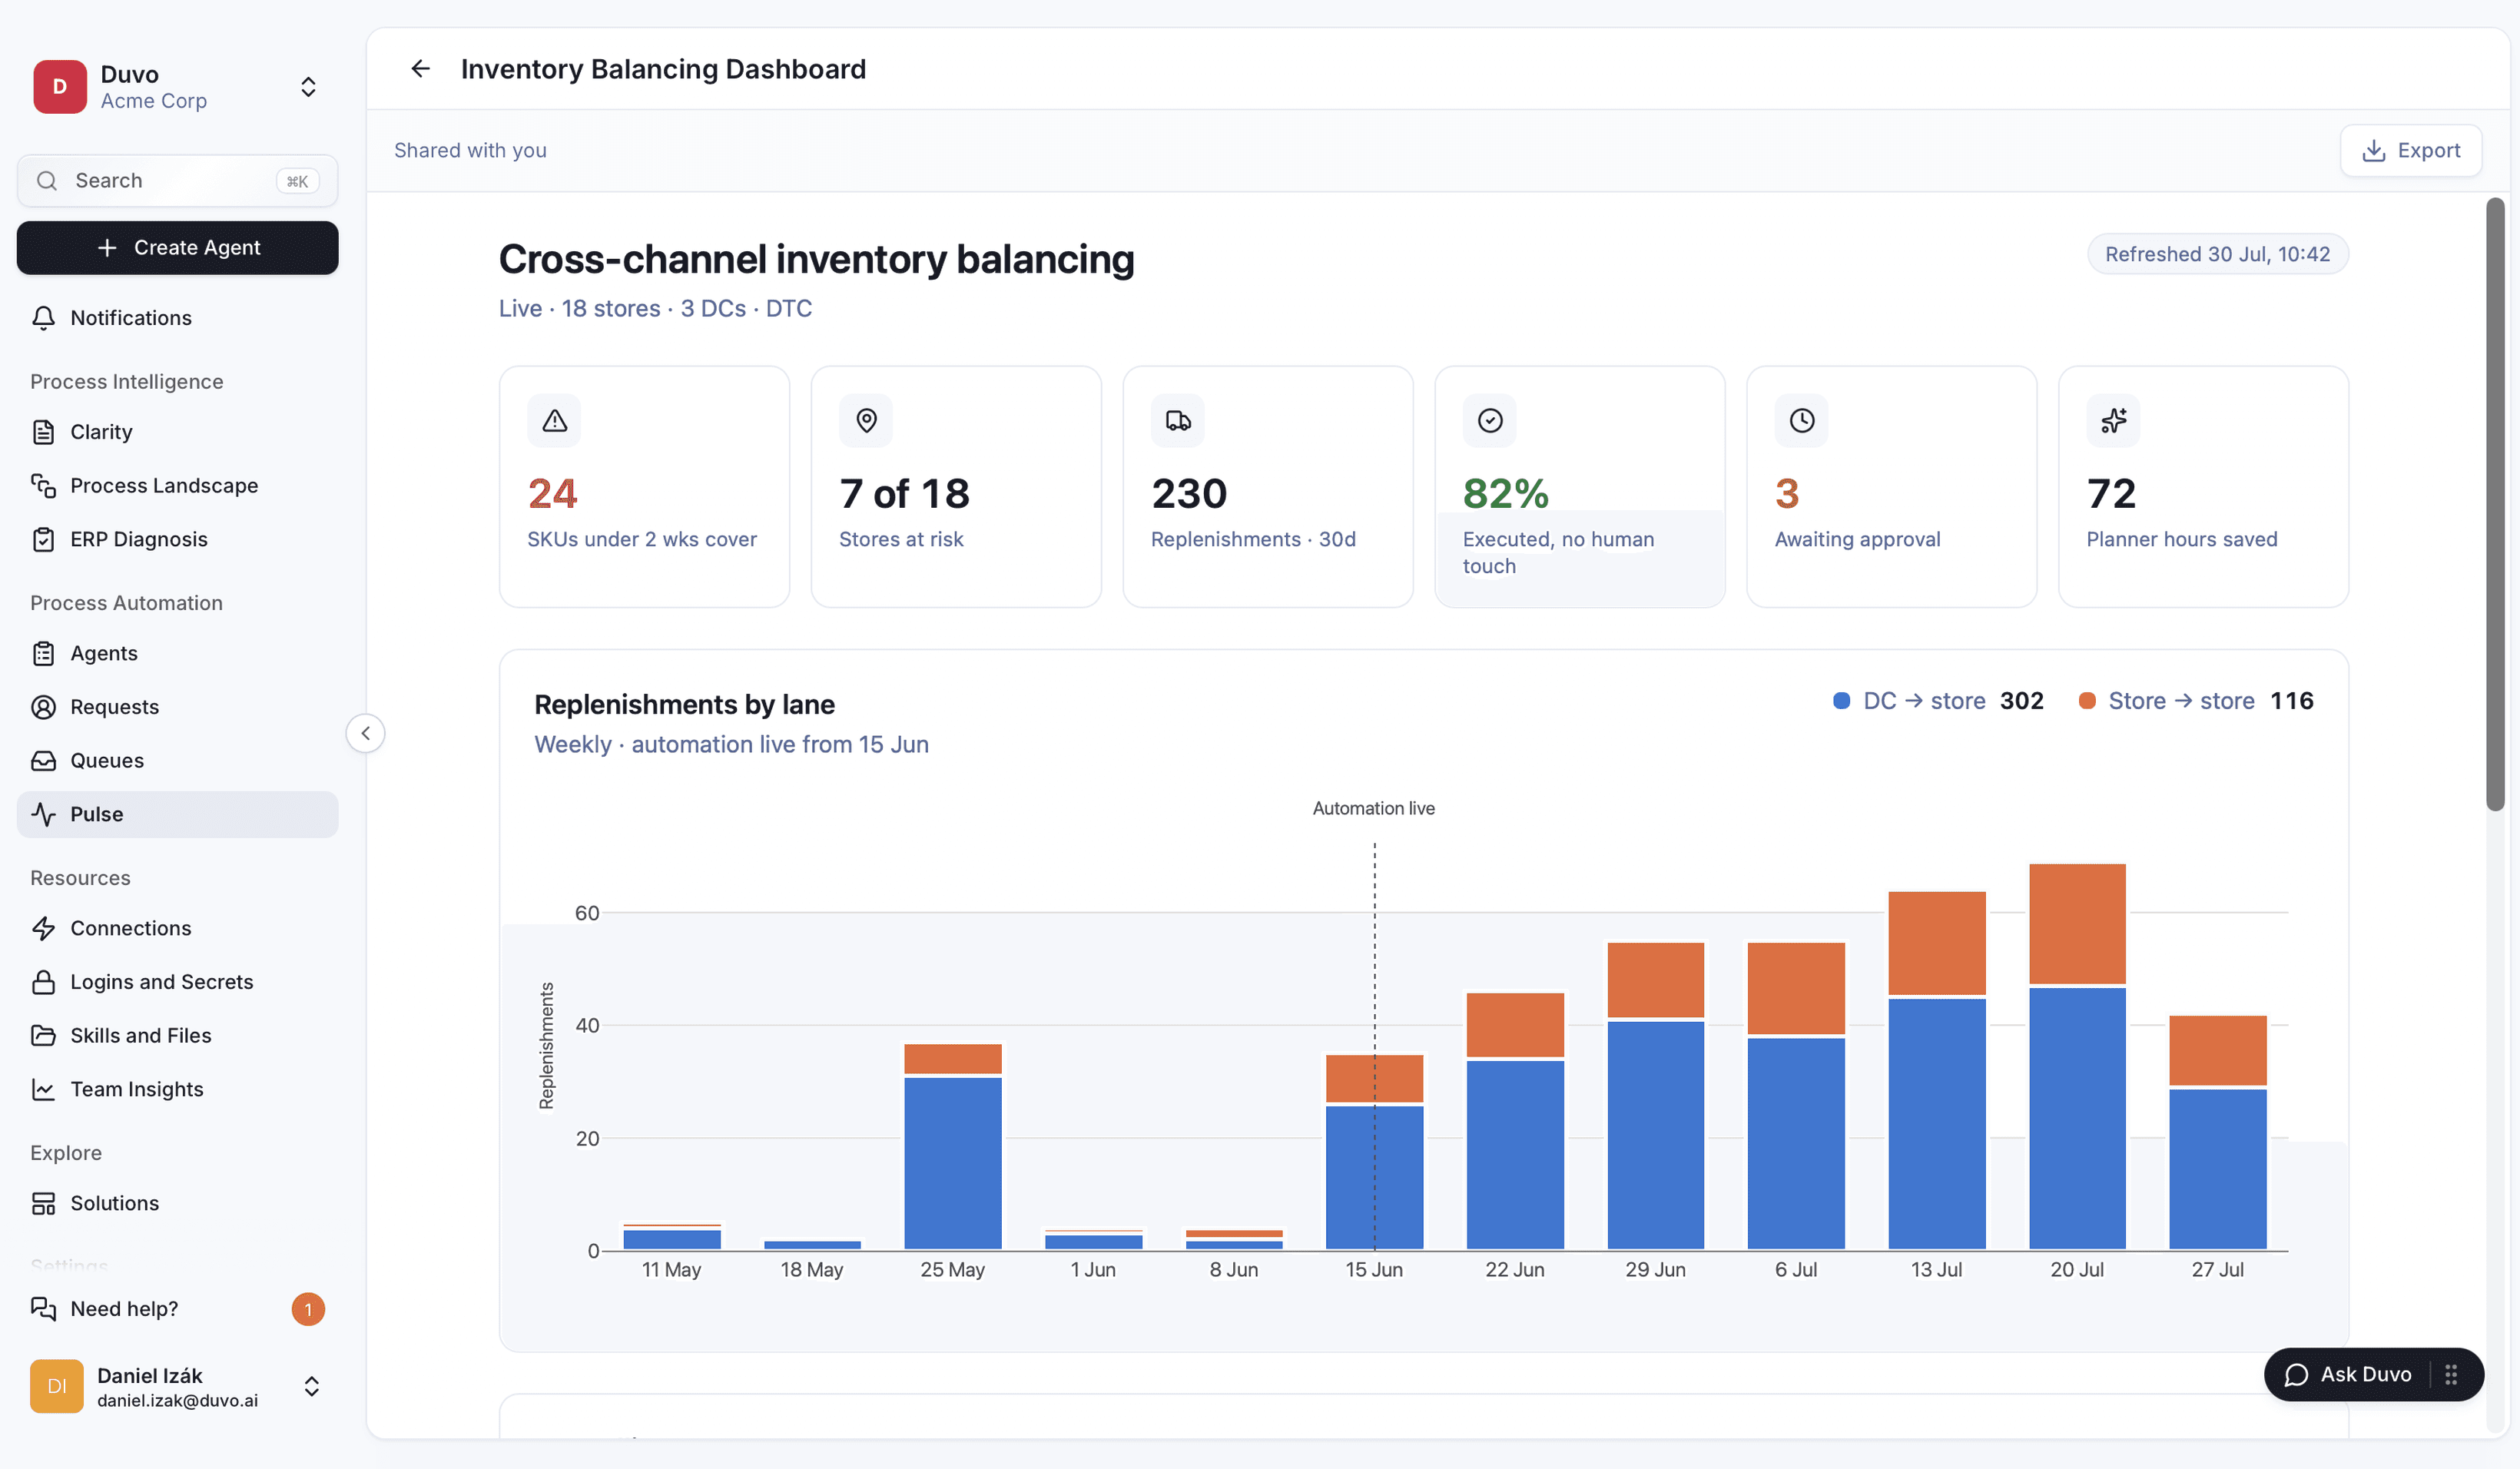
Operating Insights puts the dashboard beside the chat. Describe what you need, then refine the interactive view in place.

Duvo Operating Insights showing mode mix performance, trends, and shipment-level evidence
Scroll horizontally to inspect the interface.

Keep the operating view connected to the work behind it.

Operating Insights connects current performance to the decisions, approvals, and outcomes behind it, so teams can see what is working and where to intervene.

01

Operational KPI boards

Automation rate, processing speed, failure rate, throughput, time-to-first-action: the numbers an operations team watches every day.

02

Automation performance over time

Track reliability over time, including trends, spikes, and drop-offs.

03

Management-ready overviews

Give leaders a concise KPI view, with each number linked to the underlying work.

04

Ad-hoc investigation

Filter by reason or status, open the underlying work, and see what is driving the number.

05

Replacing the Excel + pivot workflow

The data is already in Duvo, so there’s nothing to export, clean, or wire up. You work where the work already happens.

Build a live operating view in chat.

Every view stays current and links back to the source work.

  • The dashboard fetches fresh Duvo data when it loads and applies the viewer’s permissions. There is no snapshot or nightly refresh job to maintain.

See adoption and reliability across every team.

With admin-granted org access, Operating Insights can report across teams while respecting role-based permissions. CFOs, COOs, and transformation leads can track adoption and reliability in one view.

Footprint

How much have we actually built and shipped?

Running agents vs. total agents, deployment rate, and new agents this period.

Usage

How often is it running, and how does usage compare with headcount?

Total runs, runs per user, and runs per headcount.

Reliability

Can we trust it? Where’s the risk?

Eval pass rate, fallback success rate, P1 incidents, hard-failed vs. recovered runs.

Adoption

Is the org adopting this, or is it shelfware?

Active users and active users as a percentage of headcount, by department.

From days of work to a single chat.

I can’t even count the days I’ve spent on this. It was days of work: different people involved, all sequential. Now it’s reduced to seconds, down to one Duvo dashboard.

Operations / process-excellence lead

Pilulka

We actually built an agent to monitor an agent’s performance, just to extract the data. With Duvo you’re working in the same environment, on the same data that’s already there.

Operations / process-excellence lead

Pilulka